

There is a question almost every trader asks in front of a chart: where is price going? And there is a much better question that almost nobody asks: is this market, right now, worth trading at all? The difference between the two sounds subtle, but it is what separates people who trade anything from people who trade with criteria. The ADX — Average Directional Index — exists to answer the second question.
ADX does not tell you whether the market will go up or down. It measures a single thing: the strength of the current trend, whether bullish or bearish. It is a quality filter, not a compass. And that is exactly why it is so valuable — because most of a short-term trader's losses do not come from getting direction wrong, but from insisting on trading when there is no direction at all.
What ADX actually measures
Created by J. Welles Wilder in 1978 — the same author behind RSI and ATR — the ADX is built from two components: DI+ (positive directional movement) and DI− (negative directional movement). In simple terms, DI+ measures how much the highs are advancing; DI− measures how much the lows are giving way. ADX takes the difference between the two, normalizes it, and smooths it over 14 periods by default.
The result is a line from 0 to 100 that answers: how much is this market truly moving, once you strip out the noise? An ADX at 12 says buyers and sellers are locked in a tug-of-war with no winner. An ADX at 35 says one side has taken control and is dictating the pace. Note that ADX rises in both uptrends and downtrends — direction comes from the DIs or from price structure itself.
A high ADX does not mean 'buy'. It means 'there is a trend with real strength'. Direction comes from other elements — price structure, moving averages, DI+/DI−. Confusing strength with direction is the number one mistake with this indicator.
The range table worth memorizing
ADX ranges are not laws of physics — they vary somewhat by asset and timeframe — but decades of use have consolidated reading zones that work as a solid starting map:
| ADX range | Reading | What usually happens | Sensible stance |
|---|---|---|---|
| 0–18 | No trend (ranging) | Price chops, breakouts fail, signals contradict each other | Stay out or cut exposure drastically |
| 18–25 | Transition | Embryonic trend, still fragile and reversible | Observe; demand extra confirmation before acting |
| 25–40 | Solid trend | Pullbacks respect the averages, moves have follow-through | Classic zone for trend-following strategies |
| 40–60 | Strong trend | Extended moves, shallow and fast corrections | Trail your stop; do not try to guess tops or bottoms |
| 60+ | Possible exhaustion | Climactic move; risk of a sharp reversal increases | Protect the position; avoid late entries |
Notice the detail most people miss: the most dangerous zone is not the highest one — it is the lowest. Above 60, the risk is giving profits back. Below 18, the risk is never having profits to give back.
Why trading a ranging market destroys results
Ranging markets are where trend strategies go to die. And since most popular setups — moving average crosses, breakouts, EMA pullbacks — are trend setups, the trader who ignores ADX spends a large share of their time applying the right tool to the wrong terrain.
The mechanism of destruction is always the same, and it deserves a direct look:
- Serial whipsaws: price breaks out, you enter, price snaps back, your stop is hit. In a range, the false breakout is the rule, not the exception.
- Accumulated cost: every failed attempt pays spread and possibly commission. Ten small losing trades in the chop cost what a full trend would have paid.
- Artificially tightened stops: with no room to move, the trader squeezes the stop to 'fit' the range — and becomes an easy target for noise.
- Emotional erosion: sequences of small stop-outs corrode discipline. When the real trend finally arrives, the trader hesitates or has already burned through the account's buffer.
It is not that ranging markets are untradeable — mean-reversion strategies live off them. The point is different: you need to know which regime you are in before choosing your weapon. ADX is the instrument that identifies the regime.
Get the next ones
One article a week, straight to your inbox. No spam.
How TraderClub's AI uses ADX
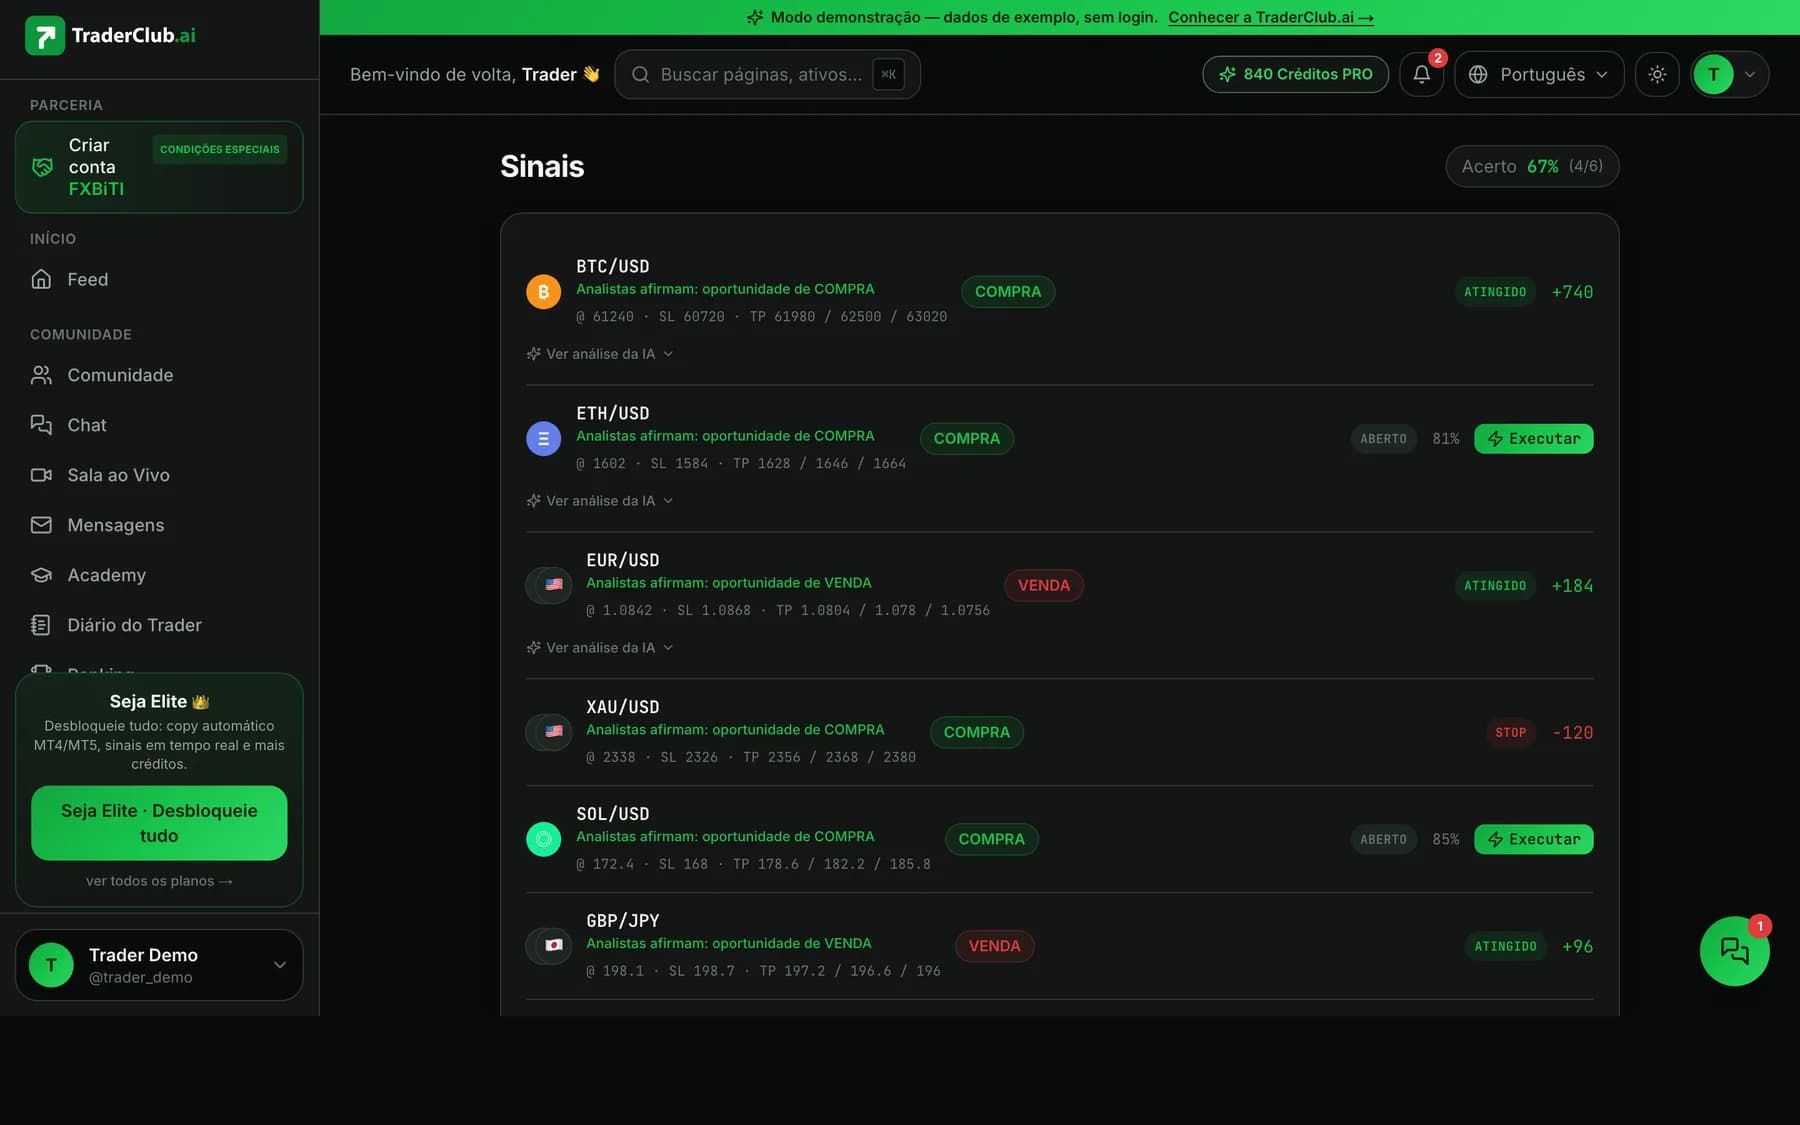
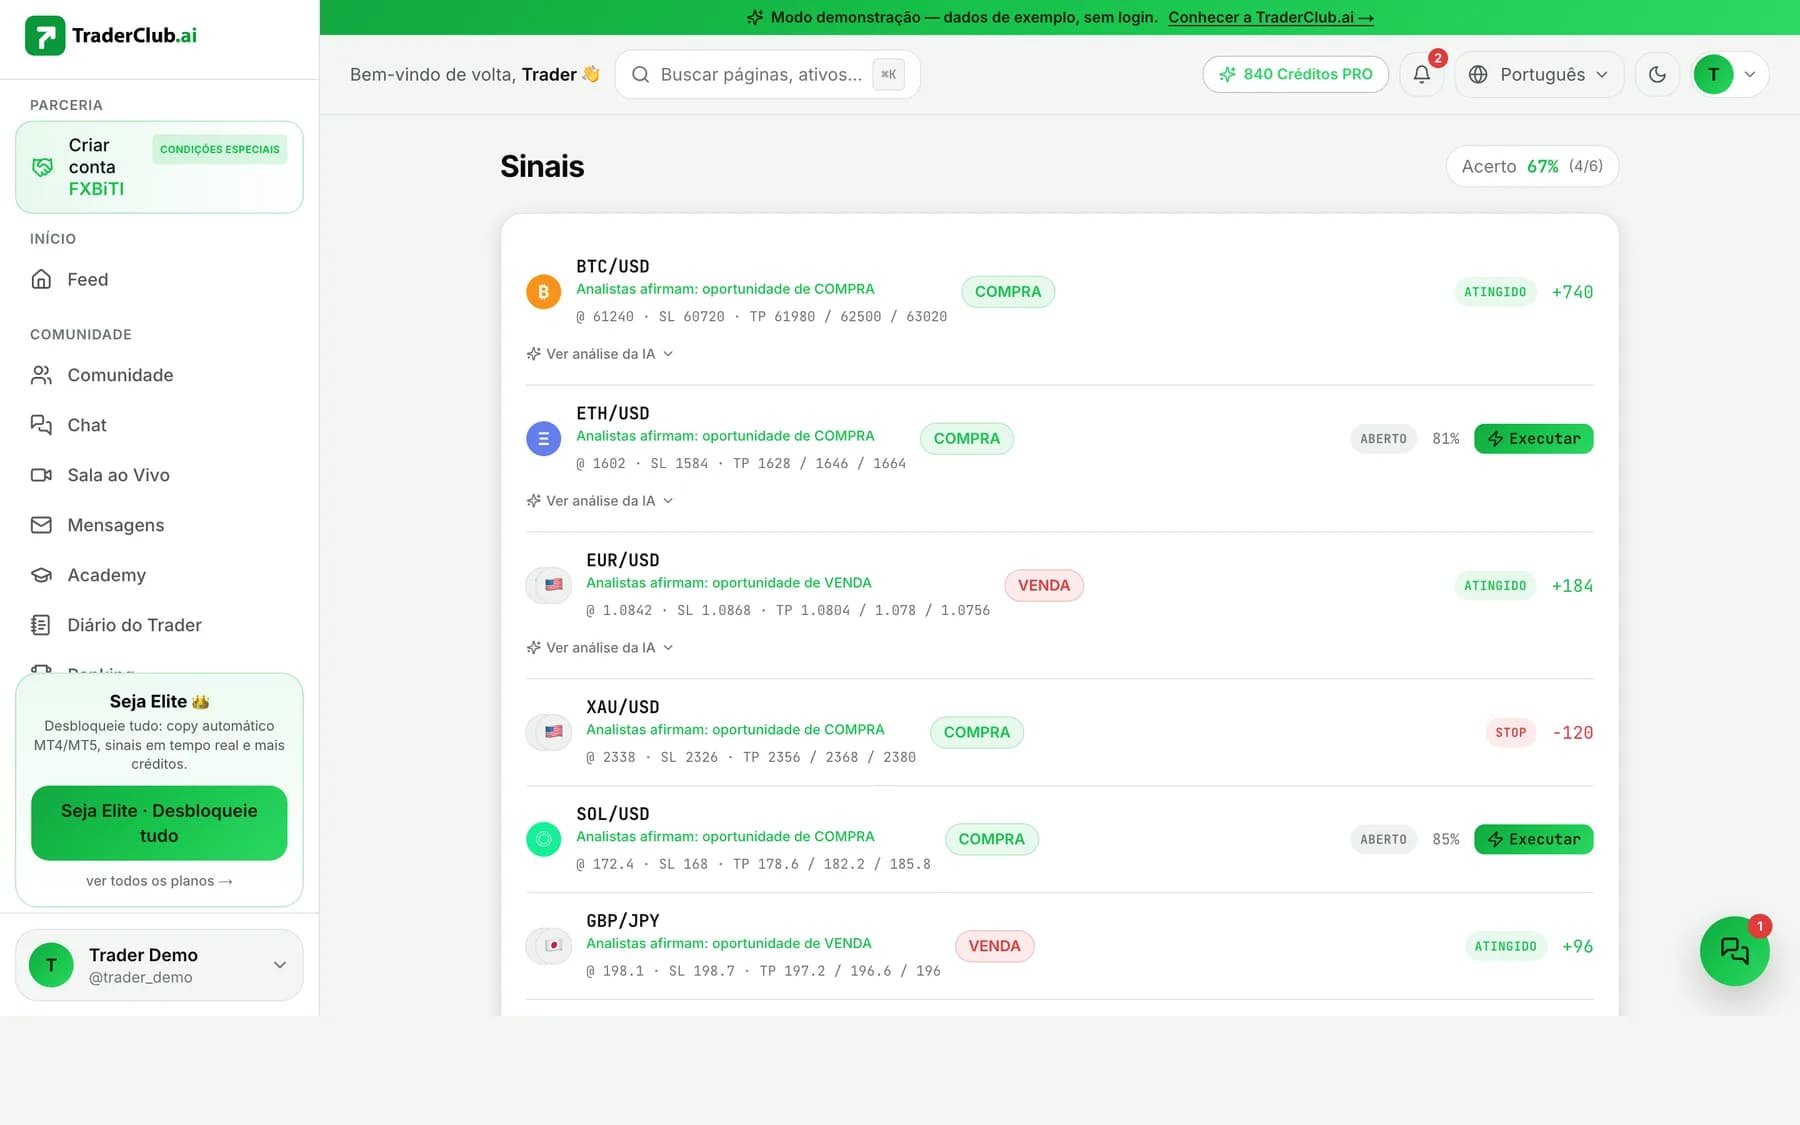
In the TraderClub.ai analysis engine, ADX is one of the four pillars of the confluence read, alongside EMA, RSI and MACD. No signal is born from a single indicator: the AI requires independent layers to point in the same direction before assigning confidence to an opportunity.
And ADX plays a special role in that architecture: it acts as a confidence reducer. When ADX sits below 18 — ranging territory — the engine automatically downgrades the confidence of any trend signal on that asset. The setup may well exist on the chart: crossed EMAs, MACD turning. But if measured strength does not support the thesis, the signal goes out with reduced confidence or simply is not published.
- ADX below 18: trend signals get their confidence downgraded — the market is not paying for the risk.
- Confluence required: EMA, RSI, MACD and ADX must support each other; one indicator never decides alone.
- Multi-timeframe confirmation: a signal on a fast chart only stands if the H1 confirms the context.
- AI risk veto: in macro event windows (rate decisions, payrolls), the Claude-powered risk layer can veto the signal entirely, even with the technicals aligned.
Every published signal enters a public track record, resolved automatically against real candles and registered in a hash-chained ledger — meaning the yardstick that validates this 'only trade when it is worth it' philosophy is auditable by anyone, not just a promise of ours.
Two practical scenarios
Scenario 1: the beautiful breakout that was worth nothing
Picture EUR/USD stuck for days in a 40-pip range. On some M15 candle, price breaks the top of the range with a full-bodied bar. Visually, it is tempting. But the period's ADX is at 14 and falling: there is no directional strength built up, only a spasm inside the range. Statistically, this is the classic portrait of a false breakout — price slips back inside the range and takes out the stop of whoever entered on emotion. A simple ADX filter would have said: this market, right now, is not worth it.
Scenario 2: the pullback with the wind at your back
Now picture gold in a defined uptrend: ADX at 32 and rising, price above the EMAs, MACD positive. A two- or three-candle correction comes into the moving average area — and RSI cools off without losing bullish ground. This is the kind of context where the whole confluence speaks the same language: strength confirmed, direction defined, entry timing at a discount. No guarantee of a winner — that does not exist — but it is a bet with the market's structure in your favor, not against you.
Use ADX as a gatekeeper, not a trigger. Before analyzing any setup, ask: does ADX authorize this type of trade in this regime? If the answer is no, the rest of the analysis does not even need to happen.
The most common ADX mistakes
- Treating ADX as a direction signal: it measures strength. A rising ADX in a falling market means the decline is gaining strength.
- Ignoring its natural lag: being doubly smoothed, ADX confirms trends rather than anticipating them. It arrives 'late' on purpose — it is a filter, not a trigger.
- Using the same yardstick on every asset: crypto and indices can sustain different readings than a low-volatility currency pair. Calibrate ranges with the asset's history.
- Looking at a single timeframe: an ADX of 30 on M15 inside a completely flat D1 is local strength inside global noise. The bigger context rules.
- Abandoning the indicator after a long range: it is precisely at the exit of prolonged compressions that an upturning ADX carries the most information.
The right question changes the game
ADX teaches a discipline that goes beyond the indicator itself: not every market moment deserves your capital. Sitting out a range is not missing an opportunity — it is preserving ammunition for the regimes where probability works in your favor. That is the same philosophy embedded in the TraderClub.ai engine: fewer signals, more criteria, and a public record of every decision.
Want to see how EMA, RSI, MACD and ADX become a single confluence read, with confidence calibrated signal by signal?
Risk warning: trading leveraged instruments involves a high level of risk and can result in the loss of your invested capital. No indicator, AI or methodology eliminates risk or guarantees results. This content is educational and does not constitute investment advice. Only trade with capital you can afford to lose.